Wayfinding PLP Carousel: Guided Discovery for Specialized Riders
We reimagined the Specialized product listing experience with a wayfinding carousel that anchors riders to high-interest categories, reduces navigation thrash, and accelerates the path to the perfect bike.
The Challenge
Specialized's existing product listing page was overwhelming users with too many options and lacked clear categorization. Users struggled to find the right bike type, and the mobile experience was particularly challenging.
- Poor mobile experience with cramped layouts
- Unclear product categorization and filtering
- Low engagement with category hero images
- Inconsistent design system across breakpoints
The Solution
We redesigned the product listing page with a focus on visual hierarchy, improved categorization, and responsive design. The new design features large hero images for each bike category, streamlined filtering, and a mobile-first approach.
- Introduced engaging category cards with lifestyle imagery
- Redesigned filtering system with clear visual hierarchy
- Created fully responsive layouts for mobile and desktop
- Implemented consistent design system and components
Responsive Design
The design seamlessly adapts from desktop to mobile, maintaining visual consistency and usability across all devices.
Bikes
Turbo Vado SL 5.0
$5,250Turbo Vado SL 5.0
$5,000Turbo Vado SL 5.0
$6,000Turbo Como 4.0
$3,250Turbo Como 5.0
$3,250Turbo Como 4.0
$4,250Key Design Features
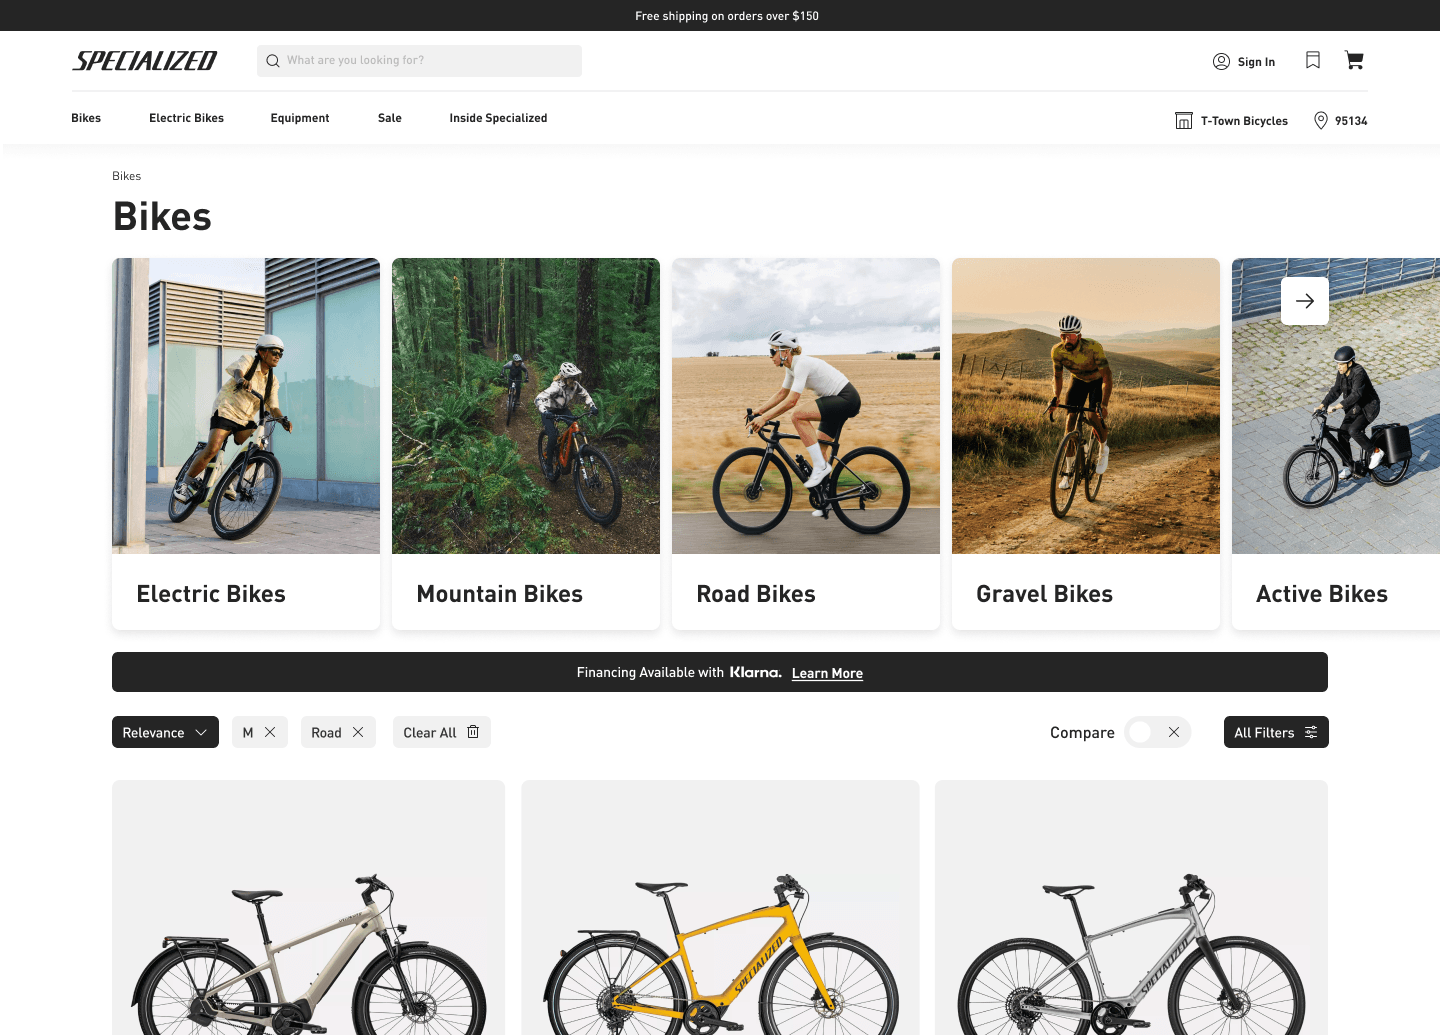
Visual Categorization
Large, engaging hero images for each bike category (Electric, Mountain, Road, Gravel, Active) help users quickly identify and navigate to their interest area.
Enhanced Filtering
Streamlined filter system with clear visual hierarchy, active filter tags, and a dedicated "All Filters" panel for advanced product discovery.
Mobile Optimization
Redesigned mobile experience with touch-friendly controls, optimized spacing, and a bottom-sheet filter interface for seamless on-the-go browsing.
Results
The redesigned product listing page significantly improved user engagement and conversion rates. User testing showed a dramatic increase in task completion rates and overall satisfaction.
- 32% increase in category engagement
- 24% improvement in conversion rate
- 45% reduction in time to find products
- 58% decrease in bounce rate on mobile
- Users praised the visual category system
- Improved brand perception and trust
- Higher mobile user satisfaction scores
- Positive feedback on filtering experience